
Deployment diagram

| UML diagram types |
|---|
| Structural UML diagrams |
| Behavioral UML diagrams |
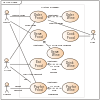
A deployment diagram[1] "specifies constructs that can be used to define the execution architecture of systems and the assignment of software artifacts to system elements."[1] To describe a web site, for example, a deployment diagram would show what hardware components ("nodes") exist (e.g., a web server, an application server, and a database server), what software components ("artifacts") run on each node (e.g., web application, database), and how the different pieces are connected (e.g. JDBC, REST, RMI).
The nodes appear as boxes, and the artifacts allocated to each node appear as rectangles within the boxes. Nodes may have subnodes, which appear as nested boxes. A single node in a deployment diagram may conceptually represent multiple physical nodes, such as a cluster of database servers.
There are two types of Nodes:
- Device Node
- Execution Environment Node
Device nodes are physical computing resources with processing memory and services to execute software, such as typical computers or mobile phones. An execution environment node (EEN) is a software computing resource that runs within an outer node and which itself provides a service to host and execute other executable software elements.
References[edit]
- ^ a b "Deployments". Unified Modeling Language 2.5.1. OMG Document Number formal/2017-12-05. Object Management Group Standards Development Organization (OMG SDO). December 2017. p. 653.
External links[edit]
- Introduction to UML 2 Deployment Diagrams by Scott W. Ambler
- UML 2 Deployment Diagram
- UML Deployment Diagrams
| Actors |
|  | |||||||||||
|---|---|---|---|---|---|---|---|---|---|---|---|---|---|
| Concepts |
| ||||||||||||
| Diagrams |
| ||||||||||||
| Derived languages | |||||||||||||
| Other topics | |||||||||||||
This Unified Modeling Language article is a stub. You can help Wikipedia by expanding it. |