
Demographics of Nottingham
| Demographics of Nottingham | |
|---|---|
 Population pyramid of Nottingham | |
| Population | 305,680 (2011) |

Nottingham, England is an ethnically and culturally diverse city. It is the sixteenth most populous city in the United Kingdom.

Population[edit]
Nottingham's total population, according to the 2011 UK census, was 305,680. The population density was 4,073 people per square km.
Ethnicity[edit]


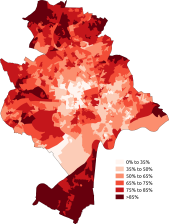
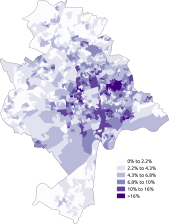
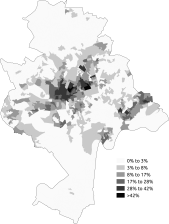
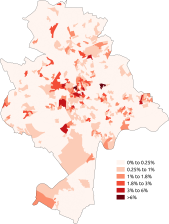
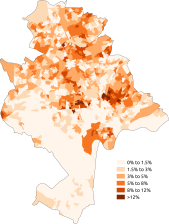
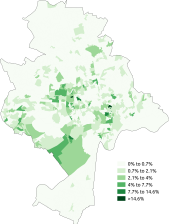
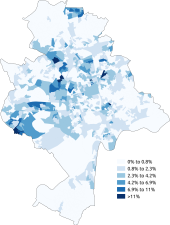
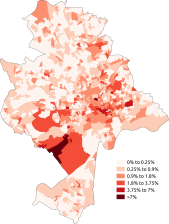
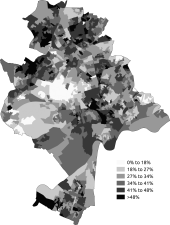
The following table shows the ethnic group of respondents in the 1991, 2001 and 2011 censuses in Nottingham. Nottingham is a majority White city with a majority of 71.5%, the largest ethnicity of which is the White British at 65.4% however this majority has been in decline since post-war migration began to the UK. Asian British residents have risen from 5.1% in 1991 to 13.1% in 2011. Black British residents have also risen with the majority of growth coming from Black Africans, going from 4.6% in 1991 to 7.3% in 2011. Mixed and Other ethnicities have also risen as a percentage of the population.
| Ethnic Group | 1971 estimations[1] | 1981 estimations[2] | 1991 census[3][4] | 2001 census[5] | 2011 census[6] | 2021 census[7] | ||||||
|---|---|---|---|---|---|---|---|---|---|---|---|---|
| Number | % | Number | % | Number | % | Number | % | Number | % | Number | % | |
| White: Total | 280,830 | 94.9% | 251,841 | 92.1% | 250,155 | 89.1% | 226,710 | 84.91% | 218,698 | 71.54% | 213,430 | 65.8% |
| White: British | – | – | – | – | – | – | 216,401 | 81.05% | 199,990 | 65.42% | 185,580 | 57.3% |
| White: Irish | – | – | – | – | – | – | 3,629 | 1.36% | 2,819 | 0.92% | 2,360 | 0.7% |
| White: Gypsy or Irish Traveller[note 1] | – | – | – | – | – | – | – | – | 326 | 0.11% | 269 | 0.1% |
| White: Roma | – | – | – | – | – | – | – | – | – | – | 1,130 | 0.3% |
| White: Other | – | – | – | – | – | – | 6,680 | 2.50% | 15,563 | 5.09% | 24,091 | 7.4% |
| Asian or Asian British: Total | – | – | 9,593 | 3.5% | 14,659 | 5.2% | 19,070 | 7.14% | 40,039 | 13.10% | 48,217 | 14.9% |
| Asian or Asian British: Indian | – | – | 3673 | 5170 | 6,096 | 2.28% | 9,901 | 3.24% | 11,515 | 3.6% | ||
| Asian or Asian British: Pakistani | – | – | 4761 | 7491 | 9,725 | 3.64% | 16,771 | 5.49% | 21,684 | 6.7% | ||
| Asian or Asian British: Bangladeshi | – | – | 194 | 327 | 533 | 0.20% | 1,049 | 0.34% | 2,223 | 0.7% | ||
| Asian or Asian British: Chinese[note 2] | – | – | 522 | 919 | 1,715 | 0.64% | 5,988 | 1.96% | 4,263 | 1.3% | ||
| Asian or Asian British: Other Asian | – | – | 443 | 752 | 1,001 | 0.37% | 6,330 | 2.07% | 8,532 | 2.6% | ||
| Black or Black British: Total | – | – | 9,896 | 3.6% | 13,249 | 4.7% | 11,582 | 4.34% | 22,185 | 7.26% | 32,215 | 10% |
| Black or Black British: African | – | – | 494 | 669 | 1,281 | 0.48% | 9,877 | 3.23% | 18,740 | 5.8% | ||
| Black or Black British: Caribbean | – | – | 7037 | 9244 | 9,189 | 3.44% | 9,382 | 3.07% | 9,339 | 2.9% | ||
| Black or Black British: Other Black | – | – | 2365 | 3336 | 1,112 | 0.42% | 2,926 | 0.96% | 4,136 | 1.3% | ||
| Mixed: Total | – | – | – | – | – | – | 8,370 | 3.13% | 20,265 | 6.63% | 19,063 | 5.9% |
| Mixed: White and Black Caribbean | – | – | – | – | – | – | 5,297 | 1.98% | 12,166 | 3.98% | 10,129 | 3.1% |
| Mixed: White and Black African | – | – | – | – | – | – | 540 | 0.20% | 2,004 | 0.66% | 2,129 | 0.7% |
| Mixed: White and Asian | – | – | – | – | – | – | 1,254 | 0.47% | 3,304 | 1.08% | 3,363 | 1.0% |
| Mixed: Other Mixed | – | – | – | – | – | – | 1,279 | 0.48% | 2,791 | 0.91% | 3,442 | 1.1% |
| Other: Total | – | – | 1944 | 2836 | 1,256 | 0.47% | 4,493 | 1.47% | 10,710 | 3.3% | ||
| Other: Arab[note 3] | – | – | – | – | – | – | – | – | 2,372 | 0.78% | 3,673 | 1.1% |
| Other: Any other ethnic group | – | – | – | – | – | – | 1,256 | 0.47% | 2,121 | 0.69% | 7,037 | 2.2% |
| Non-White: Total | 15,017 | 5.1% | 21,433 | 7.8% | 30,744 | 10.9% | 40,278 | 15.1% | 86,982 | 28.5 | 110,205 | 34.2% |
| Total | 295,847 | 100% | 273,274 | 100% | 280,899 | 100% | 266,988 | 100% | 305,680 | 100% | 323,635 | 100% |
Notes for table above
-
 White
White -
 White-British
 -
 White-Irish
 -
 White-Other
 -
 Asian
Asian -
 Asian-Indian
 -
 Asian-Pakistani
 -
 Asian-Bangladeshi
 -
 Asian-Chinese
 -
 Black
Black -
 Black-African
 -
 Black-Caribbean
 -
 Other-Arab


Ethnicity of school pupils[edit]
| Ethnic group | School year[8][9] | |
|---|---|---|
| 2021/2022 | ||
| Number | % | |
| White: Total | 23,758 | 49.1% |
| White: British | 19,730 | 40.7% |
| White: Irish | 89 | |
| White: Traveller of Irish heritage | 40 | |
| White: Gypsy/Roma | 348 | |
| White: Other | 3,551 | |
| Asian / Asian British: Total | 9,175 | 19% |
| Asian / Asian British: Indian | 1,408 | |
| Asian / Asian British: Pakistani | 5,509 | |
| Asian / Asian British: Bangladeshi | 364 | |
| Asian / Asian British: Chinese | 334 | |
| Asian / Asian British: Other Asians | 1,560 | |
| Black / Black British: Total | 5,974 | 12.3% |
| Black: Caribbean | 1,078 | |
| Black: African | 3,982 | |
| Black: Other Blacks | 914 | |
| Mixed / British Mixed | 6,678 | 13.8% |
| Other: Total | 1,812 | 3.7% |
| Unclassified | 1,034 | 2.1% |
| Total: | 48,431 | 100% |
Languages[edit]
The most common main languages spoken in Nottingham according to the 2011 census are shown below.[10]
| Rank | Language | Usual residents aged 3+ | Proportion |
|---|---|---|---|
| 1 | English | 256,411 | 87.40% |
| 2 | Polish | 6,548 | 2.23% |
| 3 | Urdu | 4,089 | 1.39% |
| 4 | Punjabi | 2,453 | 0.84% |
| 5 | Arabic | 2,372 | 0.78% |
| 6 | Persian | 915 | 0.31% |
| 7 | Kurdish | 899 | 0.31% |
| 8 | French | 858 | 0.29% |
| 9 | Portuguese | 820 | 0.28% |
| 10 | Pakistani Pahari (with Mirpuri and Potwari) | 694 | 0.24% |
| 11 | Greek | 687 | 0.23% |
| 12 | Cantonese Chinese | 609 | 0.21% |
| 13 | Spanish | 557 | 0.19% |
| 14 | Italian | 556 | 0.19% |
| 15 | Turkish | 523 | 0.18% |
| 16 | Malay | 509 | 0.17% |
| 17 | Bengali (with Sylheti and Chatgaya) | 485 | 0.17% |
| 18 | Gujarati | 464 | 0.16% |
| 19 | Lithuanian | 461 | 0.16% |
| 20 | Hindi | 460 | 0.16% |
| Other | 12,092 | 4.12% |
Religion[edit]

The following table shows the religion of respondents in the 2001 and 2011 censuses in Nottingham.
| Religion | 2001[11] | 2011[12] | 2021[13] | |||
|---|---|---|---|---|---|---|
| Number | % | Number | % | Number | % | |
| Christian | 153,962 | 57.67 | 135,216 | 44.23 | 112,200 | 34.7 |
| Buddhist | 1,122 | 0.42 | 2,051 | 0.67 | 1,671 | 0.5 |
| Hindu | 2,225 | 0.83 | 4,498 | 1.47 | 5,403 | 1.7 |
| Jewish | 627 | 0.23 | 1,069 | 0.35 | 941 | 0.3 |
| Muslim | 12,353 | 4.63 | 26,919 | 8.81 | 39,540 | 12.2 |
| Sikh | 3,321 | 1.24 | 4,312 | 1.41 | 4,110 | 1.3 |
| Other religion | 893 | 0.33 | 1,483 | 0.49 | 2,263 | 0.7 |
| No religion | 66,312 | 24.84 | 106,954 | 34.99 | 133,403 | 41.2 |
| Religion not stated | 26,173 | 9.80 | 23,178 | 7.58 | 24,099 | 7.4 |
| Total | 266,988 | 100.00% | 305,680 | 100.00% | 323,635 | 100.00% |
-
 Christianity
 -
 Islam
Islam -
 Judaism
 -
 Hinduism
 -
 Sikhism
 -
 Buddhism
 -
 Other religion
 -
 No religion


See also[edit]
- Demographics of the United Kingdom
- Demographics of England
- Demographics of London
- Demographics of Birmingham
- Demographics of Greater Manchester
- List of English cities by population
- List of English districts by population
- List of English districts and their ethnic composition
- List of English districts by area
- List of English districts by population density
References[edit]
- ^ Jones, P. N. (1978). "The Distribution and Diffusion of the Coloured Population in England and Wales, 1961-71". Transactions of the Institute of British Geographers. 3 (4): 515–532. Bibcode:1978TrIBG...3..515J. doi:10.2307/622127. ISSN 0020-2754. JSTOR 622127. PMID 12157820.
- ^ Surveys, Great Britain Office of Population Censuses and (1996). Ethnicity in the 1991 Census: Demographic characteristics of the ethnic minority populations. H.M. Stationery Office. ISBN 978-0-11-691655-6.
- ^ Surveys, Great Britain Office of Population Censuses and (1996). Ethnicity in the 1991 Census: Demographic characteristics of the ethnic minority populations. H.M. Stationery Office. ISBN 978-0-11-691655-6.
- ^ Data is taken from United Kingdom Casweb Data services of the United Kingdom 1991 Census on Ethnic Data for England, Scotland and Wales Archived 2022-04-05 at the Wayback Machine (Table 6)
- ^ "Office of National Statistics; 2001 Census Key Statistics". webarchive.nationalarchives.gov.uk. Retrieved 2021-09-07.
- ^ "2011 Census: Ethnic Group, local authorities in England and Wales". webarchive.nationalarchives.gov.uk. Retrieved 2021-12-15.
- ^ "Ethnic group - Office for National Statistics". www.ons.gov.uk. Retrieved 2022-11-29.
- ^ "School and pupil characteristics". webarchive.nationalarchives.gov.uk. Retrieved 2022-11-08.
- ^ "Schools, pupils and their characteristics, Academic Year 2021/22". explore-education-statistics.service.gov.uk. Retrieved 2022-09-09.
- ^ "Download:local authorities: county / unitary". NOMIS. Retrieved 17 June 2015.
- ^ "2001 census - theme tables". Retrieved 17 June 2015.
- ^ "Download:local authorities: county / unitary". NOMIS. Retrieved 17 June 2015.
- ^ "Religion - 2021 census". Office of National Statistics. 29 Nov 2022. Archived from the original on 29 Nov 2022. Retrieved 16 Dec 2022.